
63% of marketers segment and personalize customers’ messages based on their behavior. But what does that really mean?
It is always crucial for companies to establish what kind of relationship they possess with each subscriber, no matter how they operate. You should know exactly which contacts resonate with your content, need more nurturing, or should be completely abandoned.
Luckily, there is a practical and efficient method to determine each subscribers’ engagement level that will empower your marketing team with precious insight for future campaigns.
What is Audience Engagement Scoring?
Engagement scoring is a method used to discover and sort customer engagement into tiers used to power future campaigns. At the end of this process, each customer will have a score indicating the individual level of interaction with your content, giving marketers a clear criterion to segment their audiences. With this knowledge, your team can engage with your audience on future behavior-based campaigns using the appropriate amount of content.
This method applies to both B2C and B2B audiences. For example, retail companies benefit from audience scoring by sorting their customers for proper retargeting. B2B companies benefit from it by driving alignment between sales and marketing and giving insights into the best moments to reach out to the right audience. Another typical model for evaluating the value of your subscribers is RFM (Recency, Frequency, Monetary Value) analysis.
How does it work?
Engagement scores depict your customers’ behavior through numeric values and that change over time based on subscriber interactions (e.g. clicks, bounces) or how marketers influence them (e.g., sending more personalized communications).
On the other hand, each customer is characterized by a grade. This grade shows how interested you are in your customers, and is usually a non-numeric label (i.e., a grade from A – F). Marketers typically rely on demographic attributes (e.g. industry, city, job title, company name) to generate customer grades.
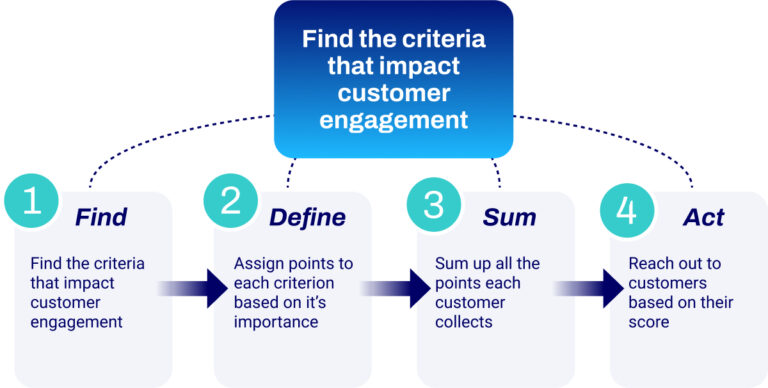
In order to calculate the full engagement score, use both behavioral data and customer attributes. The process consists of the following steps.
- Finding the criteria/attributes that have either a positive or negative impact on the customer’s engagement.
- Defining how important each criterion/attribute is and assigning positive or negative points that reflect the impact of each. For example, a customer making routine purchases will have more impact on the final score than signing up for a newsletter.
- Summing up the points each customer collects based on their actions/attributes into an overall engagement score.
- Based on the engagement score for each subscriber, placing each into corresponding tiers and devising a marketing plan for next steps.
Why use an Audience Engagement Scoring Model?
As businesses grow, your marketers are bound to receive more and more unqualified leads. Scoring allows for better tracking of customers, ranking them based on how qualified they are to make a purchase. By knowing how high each customer scores, marketers are able to allocate more resources to more qualified customers and minimize the time spent chasing dead ends.
Additionally, efficiently engaging with the most passionate customers has a positive impact on campaign metrics, increasing conversions, close rates, and response times, with more targeted campaigns, for example.
Things to keep in mind before creating your Model
To create the most effective model, you need to collect as many customer insights as possible to understand the driving factors that lead them to take action.
Sync with your sales representatives to best understand what factors affect the buying process, either positively or negatively, or conduct customer research to find what they consider important. Pro tip: do not neglect old customers’ buying behaviors – analytics give insight into factors that have historically driven purchases.
While creating scores, it is also important to define negative criteria. You should not only try to find factors that positively influence your customers’ chances of buying your products but also the ones that seem to discourage them. It is very important to filter out people who are not interested in buying your products. For instance, someone might have subscribed when visiting your website, but then only visited the job applications page. Include such criteria in your model with a negative score.
Building an Engagement Scoring Model in SFMC
Step 1: Make sure data is available in SFMC
Let’s assume you already have the required data to build your model. Before you start, make sure to bring all necessary data inside your Salesforce Marketing Cloud instance – whether it originates in Sales Cloud or an external CRM, CloudPages form submissions, an internal Marketing Cloud platform such as Contact Builder, or imported via FTP.
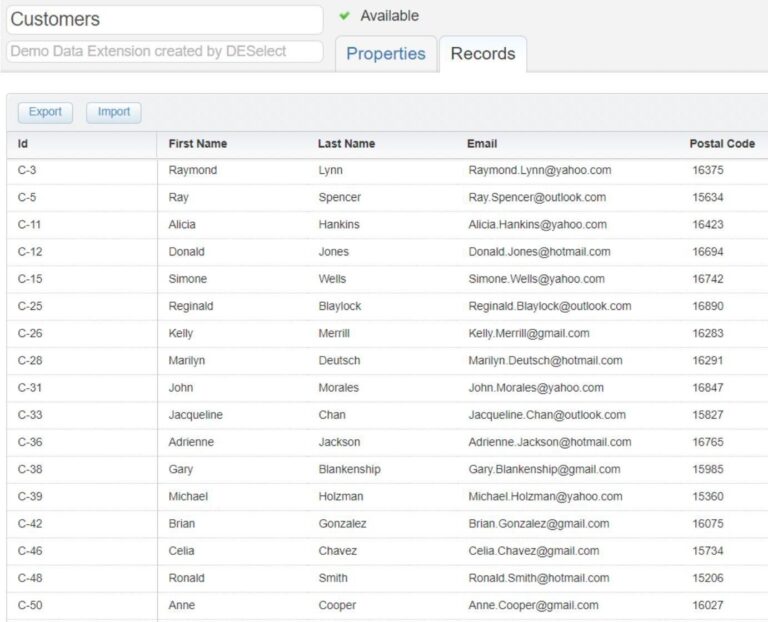
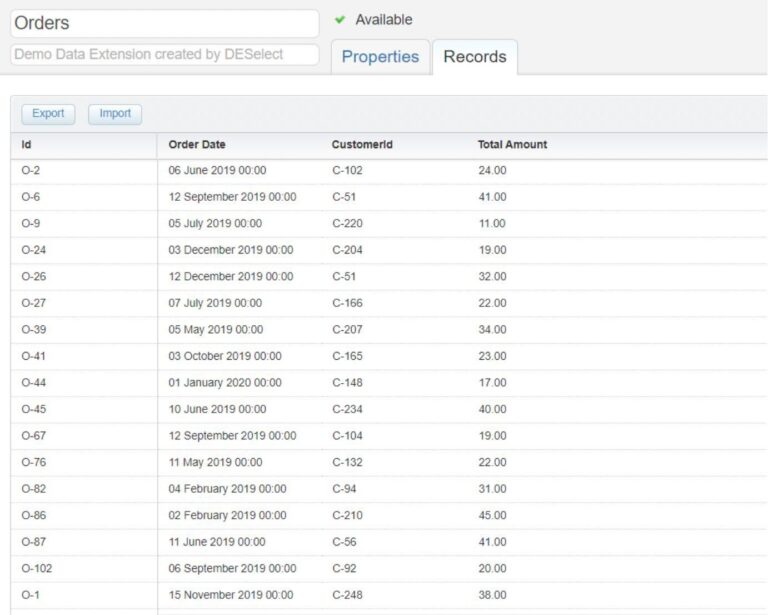
For this article, let’s use a hypothetical physical retailer as an example. To build our model we will use information about our customers’ location, orders history, and reaction to past emails. We store this data in Data Extensions and Data Views. To build our engagement model we are going to use one Data Extension that contains customer information and one that contains order information. Have a look at the two Data Extensions below.
Step 2: Define your model
After compiling the data, you need to choose the factors that make your customers more qualified. For the example we are presenting here and based on the information we have for our customers, we ended up with the following criteria and scores.
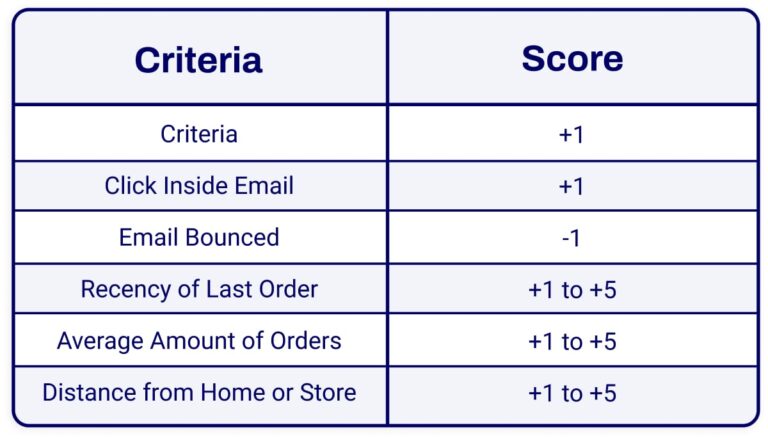
Notice how many factors have wide variations. Focusing on one, recency of last order, we find there is a scale from 1-5 correlating to how long ago a customer made their most recent purchase. Customers with orders in, say, the previous month are given a high score of 5, while customers at the opposite end of the spectrum, say, one purchase 11 months ago, are given a 1. Customers whose last order was over a year ago may be removed from this scoring system entirely to reflect how cold of a lead they are.
Ranged scoring provides greater nuance, as opposed to fixed scoring. For criteria involving frequency, having a given value often provides similar insight into customer intent. In this example, clicking an email adds one point to a customer’s score, so multiple clicks across multiple emails enhances their overall rank.
Step 3: Implement your model using DESelect
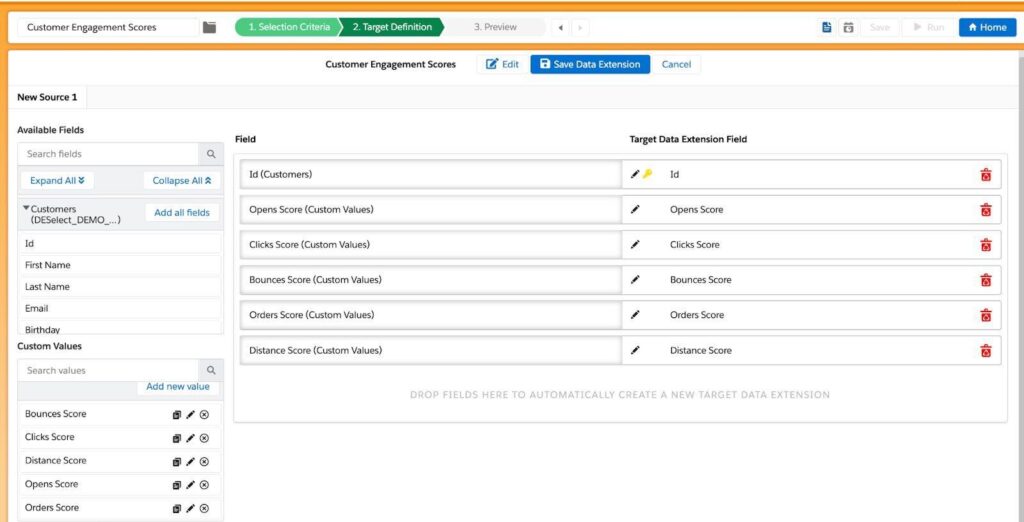
With your score criteria defined, it is time to implement the engagement scoring model using DESelect. The image below indicates the different selections created for the example, and the scores that will be calculated individually.
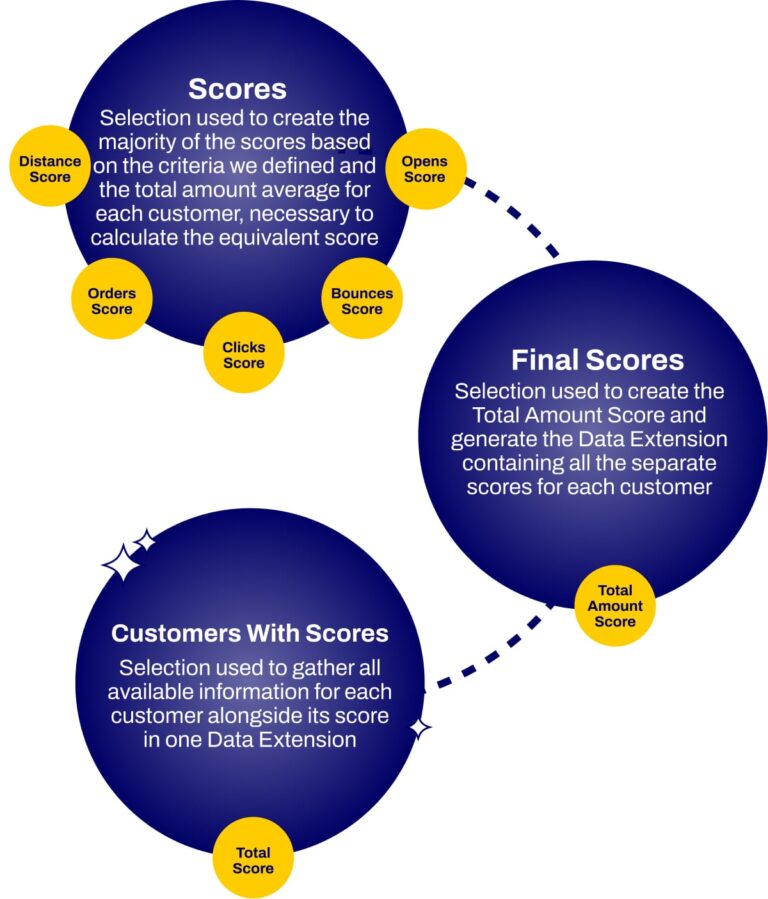
Here is a step-by-step breakdown of the process for our example.
The first thing you need to do is create a selection that will calculate the points each customer collects for each criterion and store it in a Data Extension.
1. Open DESelect inside your Marketing Cloud instance
2. Click on New Selection to create a new selection.
3. Provide the name Customer Engagement Scores (or similar) for your selection.
4. Choose your Selected Data Extensions, in this case Data Extensions Customers and Orders.
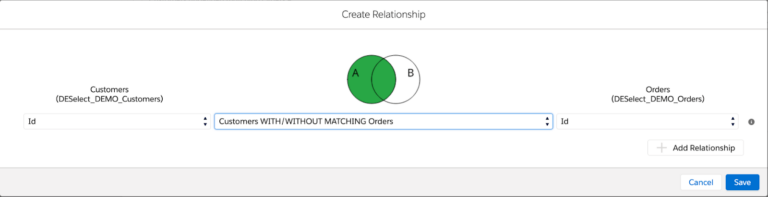
5. Create a relationship between them on Id and CustomerId fields, and keep all records from Customers Data Extension.
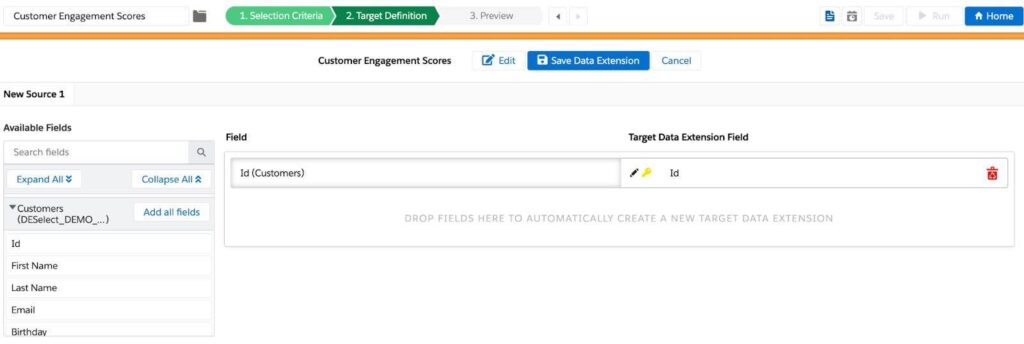
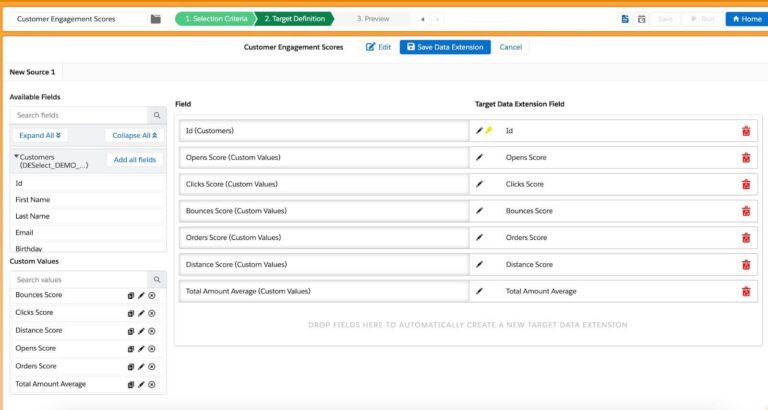
6. Move on to the Target Definition screen and click on Create Data Extension.
7. Provide the name Customer Engagement Scores and click Save.
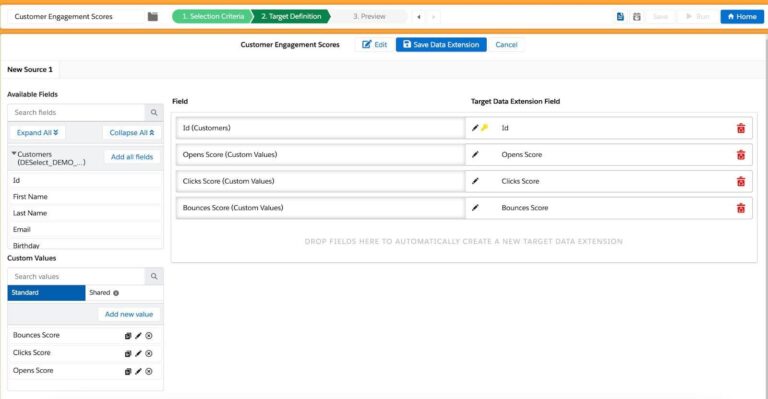
8. Add the Id field of the Customers Data Extension to Target Data Extension fields.
Opens – Clicks – Bounces Score
We will now calculate the points for opens, clicks, and bounces. At this point we are not yet interested in positive and negative scores, therefore we will calculate these three fields in exactly the same way. This will also help evaluate overall email deliverability and engagement by counting how many times a customer has opened an email, clicked inside an email, or bounced out of an email.
This information can be found inside Data Views, which are tables generated by SFMC. Through Data Views you’ll find data such as subscribers and Marketing Cloud event tracking (e.g., email/sms sends, email opens, link clicks).
1. Click on Add new value inside the Custom Values section.
2. Set name to Opens Score, choose Aggregation as type and click on Next.
3. Choose Count as the aggregation function.
4. Choose SubscriberKey of _Open Data View as the field.
5. Match Customers’ Email field with _Open ’s SubscriberKey field. The Custom Value looks like this:
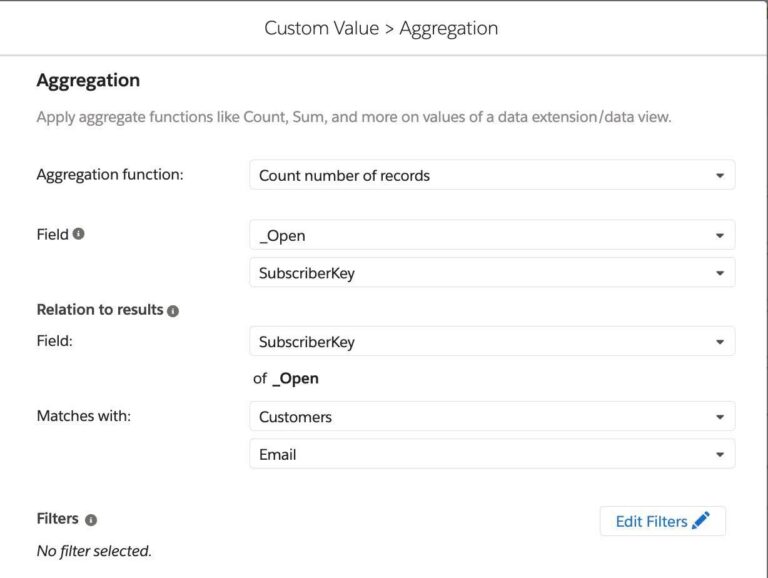
6. Click on Save.
7. Repeat steps 1 – 6 for _Click and _Bounce and name them Clicks Score and Bounces Score respectively.
8. Add all the created values to the Target DE’s fields.
Orders Score
Next, we will assign points to customers based on when they placed an order. Based on our data we defined the following rules:
- 1 point, for orders in the past year.
- 2 points, for orders in the past 9 months.
- 3 points, for orders in the past 6 months.
- 4 points for orders in the past 3 months.
- 5 points, for orders in the past month.
To assign the different scores to our customers we will perform the following steps:
1. Click on Add new value inside the Custom Values section.
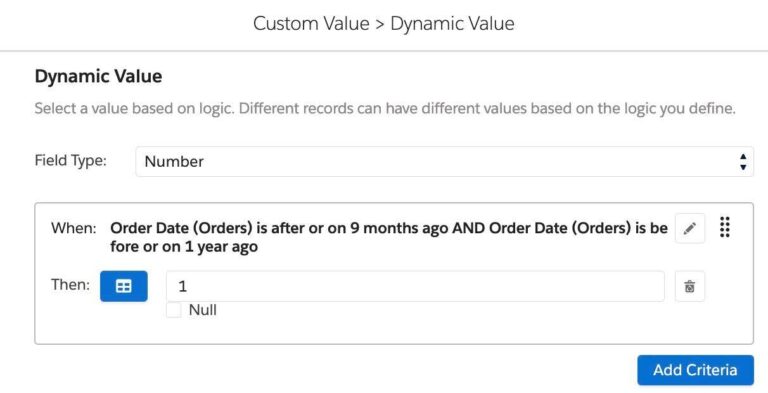
2. Set name to Orders Score, choose Dynamic Value as type and click on Next.
3. Select Number as field type and click on Add Criteria.
4. Add Order Date from Orders DE to the filters section.
5. Choose Is After Or On as filter type.
6. Select Relative date and set it to 9 months ago.
7. Add Order Date from Orders DE second time to the filters section.
8. Choose Is Before Or On as filter type.
9. Select Relative date and set it to 1 year ago.

10. Set the Then value equal to 1. Our custom value looks like this:
11. Repeat steps 3 – 6, but set the Relative date to match the criteria we defined above, and the then value to the equivalent amount of points.

12. Make sure the Default value is 0 and click on Save.
13. Add the created value to our Target DEs fields.

Distance Score
Moving forward, we want to assign scores based on the distance from customers’ homes to our physical location. We will do that based on their postal codes. We know about the Postal Codes that values:
- Between postal codes 15019-15378 are 5 km away from our store, and will get 5 points.
- Between postal codes 15378-15737 are 10 km away from our store, and will get 4 points.
- Between postal codes 15737-16096 are 15 km away from our store, and will get 3 points.
- Between postal codes 16096-16455 are 20 km away from our store, and will get 2 points.
- Greater than postal code 16455 are more than 20 km away from our store, and will get 1 point.
To assign the different scores to our customers we will perform the following steps.
1. Click on Add new value inside the Custom Values section.
2. Set the name to Distance Score, choose Dynamic Value as type and click on Next.
3. Select Number as field type and click on Add Criteria.
4. Add Zip Code from Orders DE to the filters section.
- Note: Depending on your organization’s data model, this field may be labeled Postal Code and may be nestled under the Customers data extension.
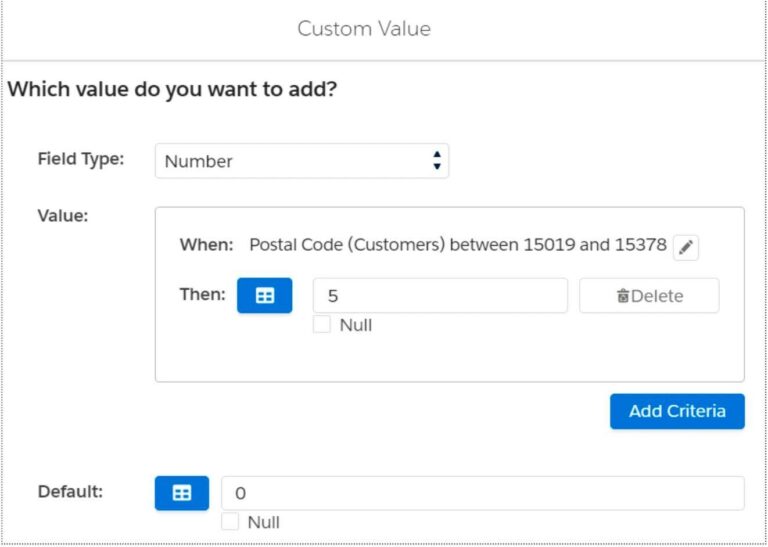
5. Choose Between as the filter type.
6. Set the first input field to 15019 and the second to 15378.

7. Click on Save and set the Then value equal to 5. Our Custom Value looks like this.
8. Repeat steps 3 – 7 for the rest of the postal codes mentioned above, each time decreasing the Then value by 1. In the last group choose Greater Than as filter type.

9. Make sure the Default value is 0 and click on Save.
10. Add the created value to our Target DE’s fields.
Total Amount Average
Finally we want to assign a different score based on the average of the total dollar amount a customer has spent on purchases in this time period (in our example, one year). We identified the following groups.
- Average between 0 – 25 gets 1 point.
- Average between 25 – 50 gets 2 points.
- Average between 50 – 75 gets 3 points.
- Average between 75 – 100 gets 4 points.
- Average above 100 gets 5 points.
To get the customers of each group we need to first calculate the average of the total amount for each customer.
1. Click on Add new value under the custom values section.
2. Set the name to Total Amount Average, choose Aggregation as type and click on Next.
3. Select Average value for field as the aggregation function.
4. Choose Total Amount from the Orders Data Extension as the field.
5. Match Orders’ CustomerId field with Customers’ Id field. Our Custom Value looks like this.
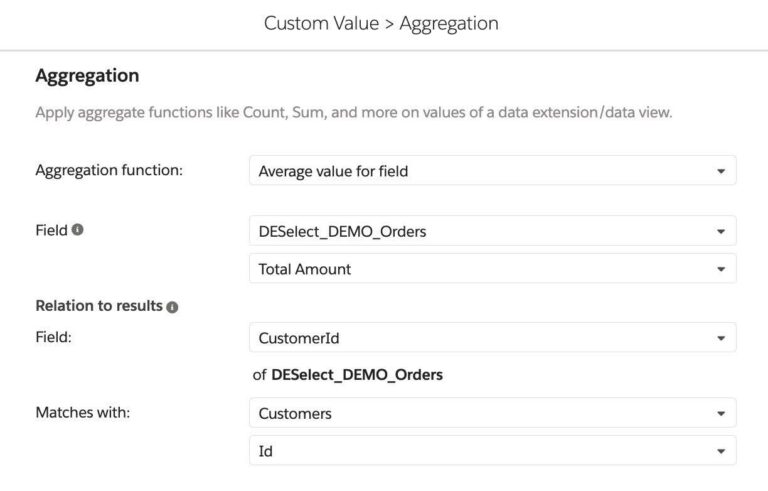
6. Click on Save.
7. Add the created value to our Target DE’s fields.
8. Click on the Save Data Extension button.
9. Save your work on the Selection itself. Exit to the DESelect Segment homepage.
10. Click on the Create button.
In order to create the Total Amount Score based on the Total Amount Average we need to create a new selection.
1. Click on Run to populate our Customer Engagement Scores Data Extension with results.
2. Click on the New Selection button.
3. Name it Final Customer Engagement Scores.
4. Add Customer Engagement Scores Data Extension to our Selected Data Extensions.
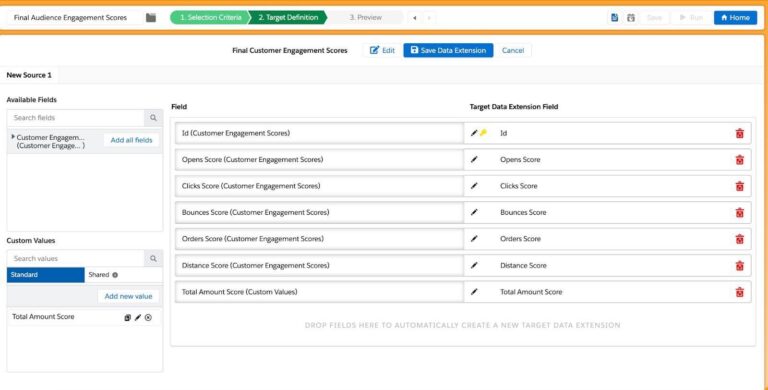
5. Move on to the Target Definition screen and click on Create Data Extension.
6. Provide the name Final Customer Engagement Scores and click Save.
7. Click on the Add All Fields button.
8. Remove the Total Amount Average field.
Total Amount Score
Now we can calculate the Total Amount Score by implementing the following steps.
1. Click on Add new value inside the Custom Values section.
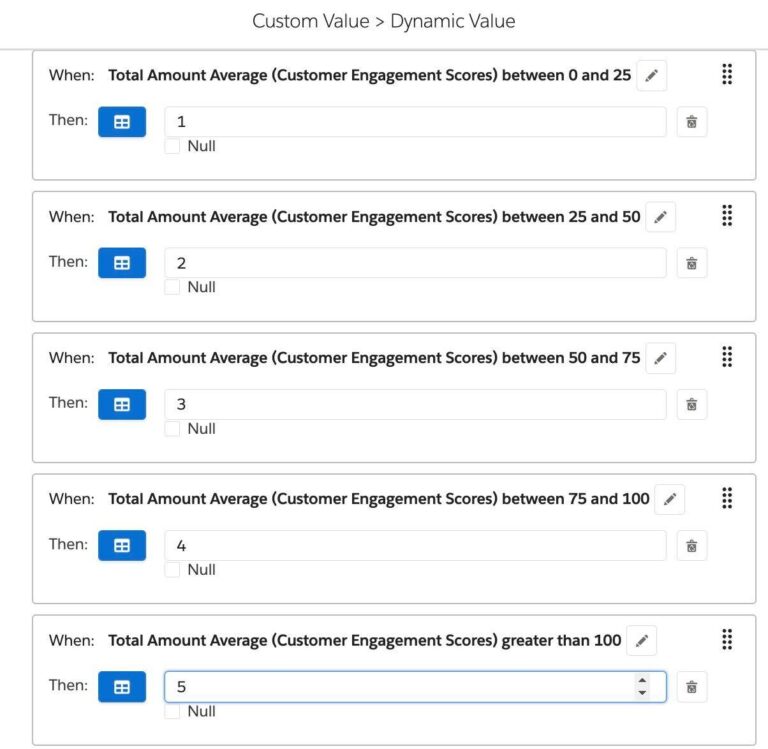
2. Set the name to Total Amount Score, choose Dynamic Value as type, and click on Next.
3. Select Number as field type and click on Add Criteria.
4. Add Total Amount Average from Customer Engagement Scores Data Extension to the filters section.
5. Choose Between as the filter type.
6. Set the first input field to 0 and the second to 25.

7. Click on Save and set the Then value equal to 1. Our Custom Value looks like this.

8. We repeat the steps 3 – 7 for the rest of the averages mentioned above, each time increasing the Then value by 1. In the last group choose Greater Than as filter type.
9. We make sure the Default value is 0 and click on Save.
10. We add the created value to our Target DE’s fields.
11. At the top click to Save Data Extension, then confirm with Create.
12. Click on Run to create the data extension. You can also Preview beforehand in the Preview section.
Calculate each customer’s Total Engagement Score
After calculating each criteria score separately, it is time to sum them up and end up with a single audience engagement score per customer.
1. Create a new selection and name it Customers With Score.
2. Add our Final Customer Engagement Scores Data Extension.
3. On the target definition screen create a Customers with Score Data Extension.
4. Add the Id field to our Target Data Extension.
5. Click on the Add new value button.
6. Set the name Total Engagement Score, choose Apply formula to a field and click Next.
7. Click Apply any function and Next.
8. Choose Number as the field type.
9. Select the Opens Score field of Final Customer Engagement Scores DE in the dropdown and click Insert Field.
10. Add a plus operator (+).
11. Do the same for Clicks Score , Bounces Score, OrdersScore, Distance Score and Total Amount Score. Though because Bounces has a negative score, we change the plus (+) icon in front of this field to a minus (-). The formula should look like this.
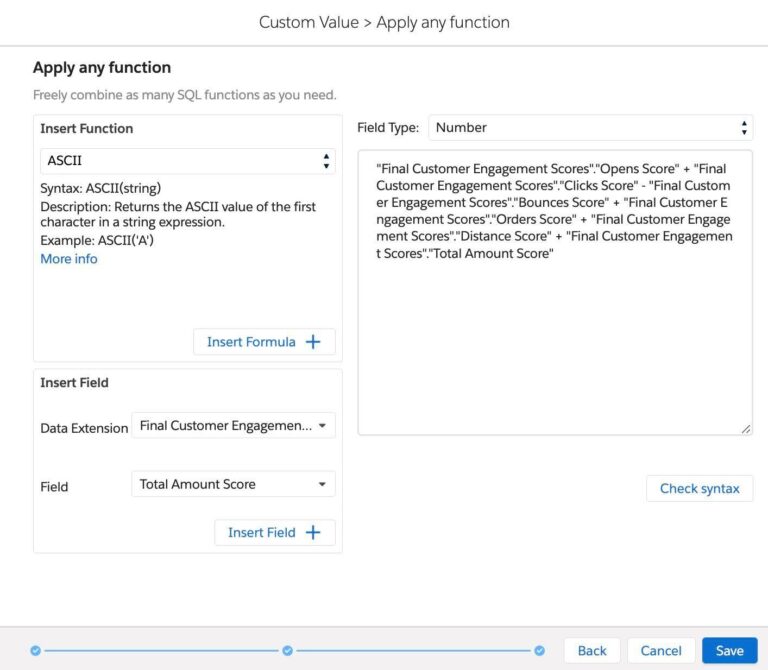
12. Double-check the accuracy of your SQL syntax with Check syntax.
13. Add the Total Engagement Score field to the Target Data Extension.

14. Click on Save Data Extension.
15. Click Create.
16. Click on Run.
Conclusion
After following these steps, you should be able to rank your most valuable subscribers and identify the ones that haven’t been engaging with your content. Just because a customer has a low engagement score, it does not mean they should be crossed out of your contact list. In fact, the opposite is true: contacts with low scores indicate they need a different type of content to engage with.
Engagement scoring is just one way to create detailed audiences that take your customer communications to the next level. Learn how DESelect Segment’s advanced segmentation allows marketers to create highly personalized campaigns based on behavioral data, advanced logic, transaction data, and more – all without code.